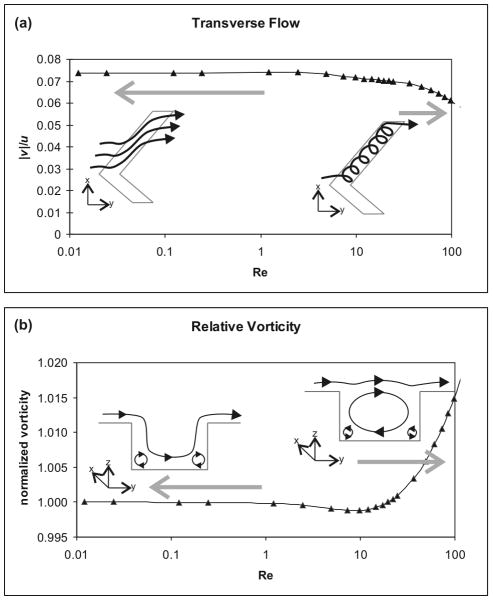
Figure 3.
Flow rate behavior of the SHM, with illustrations of fluid motion. (a) The relative magnitude of transverse flow induced by the herringbone grooves was relatively stable Re < 1, but decreased as recirculation within the herringbones developed, resulting in substantially degrading performance for Re > 36. (b) The total vorticity was scaled to flow rate and normalized to reflect the relative magnitude over a range of flow rates. Illustrations depict a projection along the length of the groove. A slight dip in relative vorticity above Re = 1 revealed the dissolution of minor eddies in the corners of features before larger vortices were established in the herringbone grooves at Re > 10.

