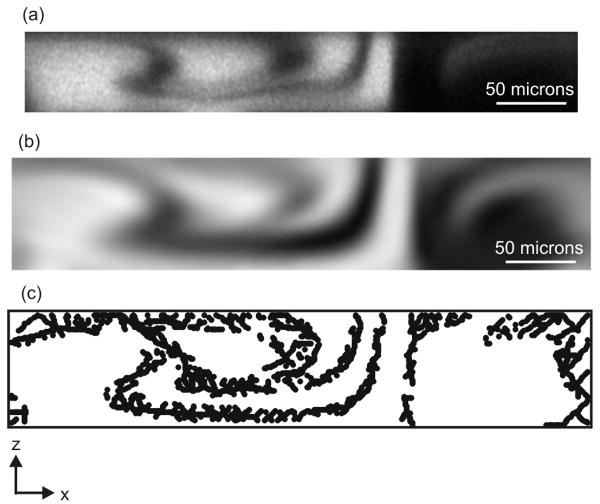
Figure 4.
(a) Confocal micrograph showing a cross-section of the 56 μm × 392 μm channel perpendicular to flow and downstream of cycle 1.5, with 40kDa dextran mixing with buffer at 30 μl/min (Pe = 8.33×10⁴). The image has been adjusted to show the tendrils of fluid. (b) Surface plot of COMSOL model in the same location of the mixer, using D = 5×10-11 m2s-1 at 30 μl/min (Pe = 6.25×10⁴) in the 80 μm × 410 μm channel. (c) Plot of points from the exported COMSOL data identified by the MATLAB algorithm as part of the interface.

