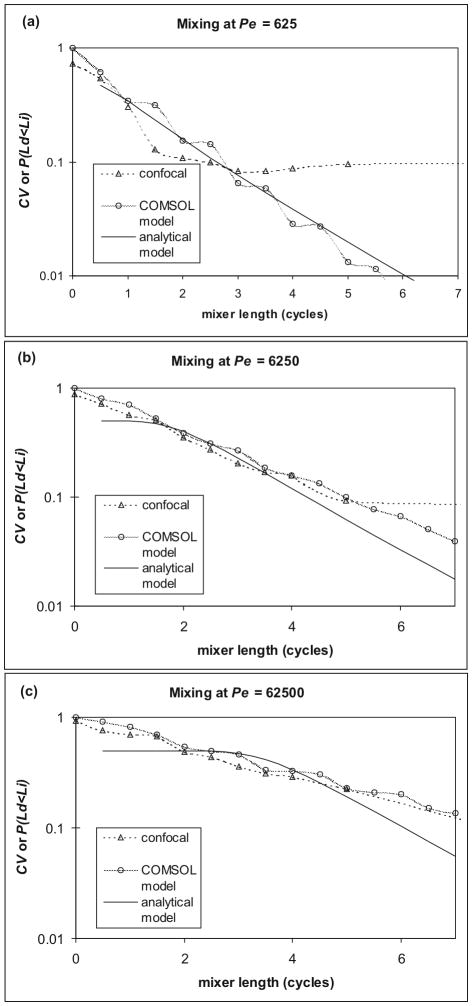
Figure 5.
Comparison of confocal mixing data (triangles, dashed line) to COMSOL (circles, shaded line) and analytical (solid line) models at Pe = 6.25×10² (a), Pe = 6.25×10³ (b), and Pe = 6.25×10⁴ (c). Confocal and COMSOL were quantified by CV, while the analytical model refers to P(Ld<Li); both are plotted on the same axis. Confocal data reached baseline just below CV = 0.1, which is particularly evident at low Pe. COMSOL models oscillated slightly during the exponential decline due to processing errors. While confocal and COMSOL appeared to give a pure exponential decline, the analytical model predicted a Pe-dependent length with little change in mixing, followed by an exponential decline of P(Ld<Li) with a Pe-independent slope. The noise and resolution limits of the confocal and COMSOL data may have obscured such behavior.

