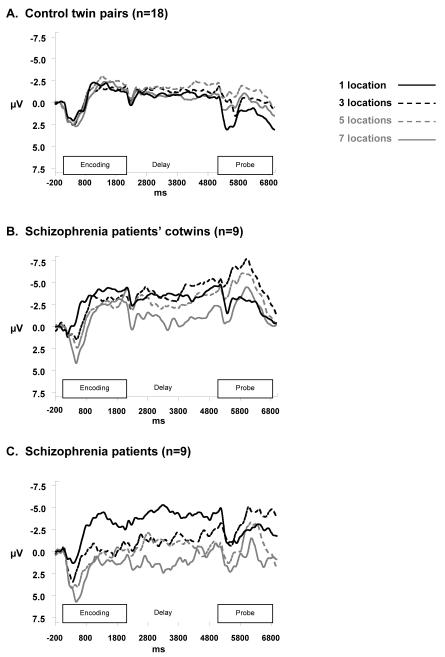
Figure 3. CNV Waveforms over Entire Trial at Cz’.
CNV waveforms at Cz’ during memory set encoding period (0 – 2000 ms) and delay period (2000 – 5000 ms), displayed across memory load levels for controls (A), for patients’ cotwins (B), and schizophrenia patients (C). Waveforms were low-pass filtered at 16 Hz and smoothed with a weighted, 15-point moving average for display purposes only.

