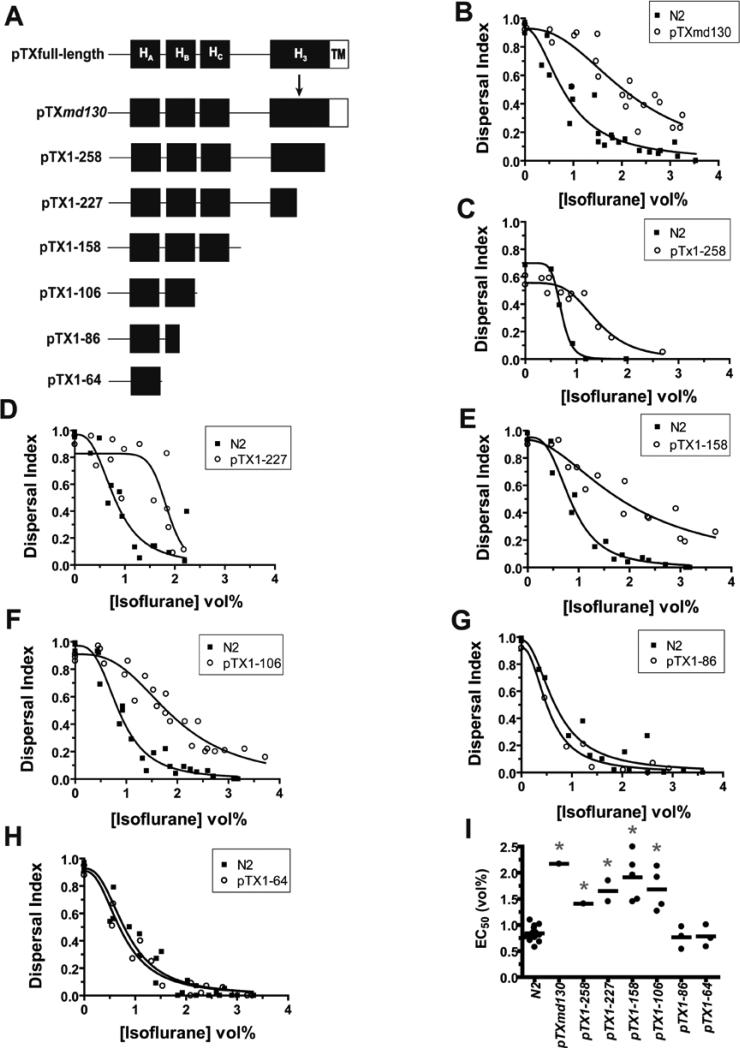
Fig. 1.
Syntaxin structural requirements for isoflurane antagonism. (A) Predicted syntaxin products generated from transforming plasmid constructs. The relative locations of the four helical domains, HA, HB, HC, and H3, and the C-terminal transmembrane domain, TM, are shown. pTXmd130 contains the g-a splice donor mutation in the 6th intron following codon 228 (position denoted by arrow) found in unc-64(md130) (B) Isoflurane sensitivity of locomotion (dispersal index) of a pTXmd130 transformed strain vs that of the concurrently tested wild-type strain N2. EC50s: N2 – 0.84 ± 0.09, pTXmd130 – 2.17 ± 0.18 - p < 0.0001. (C) Isoflurane sensitivity of pTX1−258 vs N2. EC50s: N2 – 0.71 ± 0.02, pTX1−258 – 1.41 ± 0.09 - p < 0.0001. (D) Isoflurane sensitivity of pTX1−227 vs N2. EC50s: N2 – 0.81 ± 0.10, pTX1−227 – 1.85 ± 0.09 - p < 0.0003. (E) Isoflurane sensitivity of pTX1−158 vs N2. EC50s: N2 – 0.86 ± 0.05, pTX1−158 – 1.96 ± 0.20 - p < 0.0001. (F) Isoflurane sensitivity of pTX1−106 vs N2. EC50s: N2 – 0.87 ± 0.05, pTX1−106 – 1.92 ± 0.09 - p < 0.0001. (G) Isoflurane sensitivity of pTX1−86 vs N2. EC50s: N2 – 0.68 ± 0.09, pTX1−86 – 0.54 ± 0.06 - p = 0.24. (H) Isoflurane sensitivity of pTX1−64 vs N2. EC50s: N2 – 0.75 ± 0.06, pTX1−65 – 0.83 ± 0.07 - p = 0.45. (I) Summary scatter plot of all transformants. Each point represents the EC50 derived from the pooled concentration response data for each independently transformed strain except for N2 where each point represents the EC50 for a particular experiment. * p < 0.01 for each transformed strain versus the concurrently measured N2 EC50. All comparisons by shared-parameter simultaneous curve-fitting.

