Fig. 1.

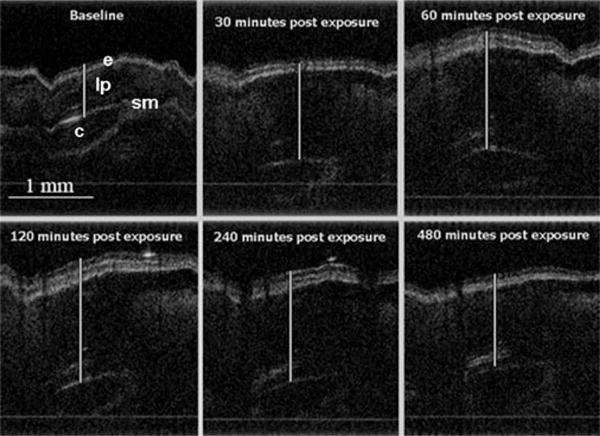
OCT of a rabbit trachea exposed to CEES. Airway tissue region thickening can be seen throughout the duration of the experiment. Epithelium (e), cartilage (c), submucosal layers (sm), and lamina propria (lp) are easily visualized.

OCT of a rabbit trachea exposed to CEES. Airway tissue region thickening can be seen throughout the duration of the experiment. Epithelium (e), cartilage (c), submucosal layers (sm), and lamina propria (lp) are easily visualized.