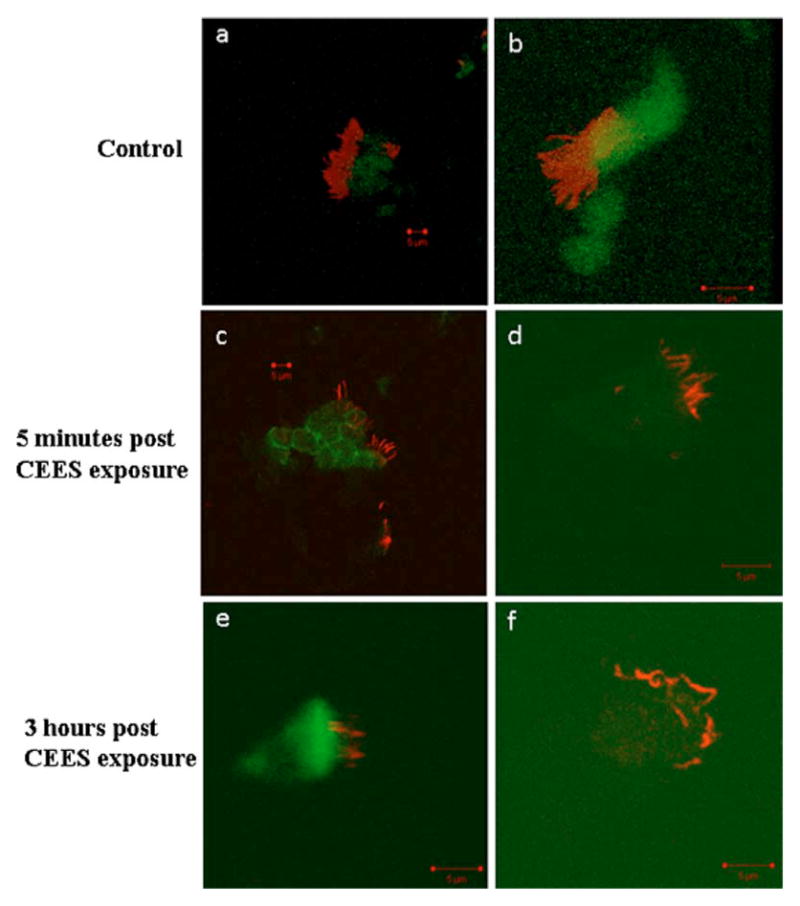
Fig. 5.

Actin and microtubule staining of control and CEES exposed rabbit tracheal epithelial cells (RTEC) show the degeneration of the cytoskeleton. (a) and (b) show an abundance of actin in green within the RTEC cell body, and microtubules in red that localize to the ciliated structures at the cell periphery. (c) and (d) show the cytoskeleton of RTEC cells 5 min following CEES exposure. A loss in actin signal within the cell body is observed as well as a decrease in the amount of ciliated structures at the periphery of the cell. (e) and (f) show the cytoskeleton of RTEC cells 3 h following CEES exposure. Similar to the 5-min exposed cells, a less intense actin signal is observed. At this time point, the largest changes were observed in the ciliated structures where the number of ciliated structures decreased substantially. Those structures that are present are significantly distorted, showing many irregular twists within the microtubule structures. (Color online only.)
