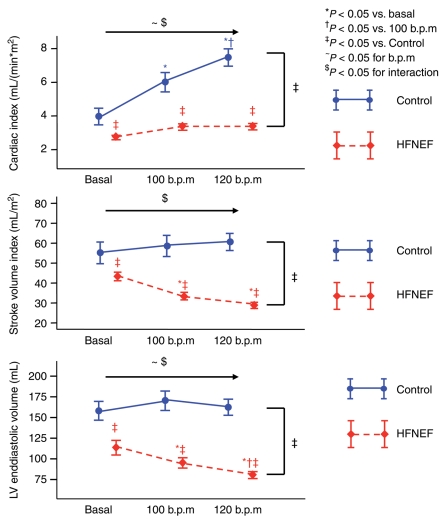
Figure 5.
Cardiac index, stroke volume index, and left ventricular end-diastolic volume at comparable baseline heart rate and at pacing rates of 100 and 120 b.p.m. All data are shown as mean ± SEM. Data are shown in red for the HFNEF and in blue for the control patients. Results of the multiple measurements ANOVA are shown above the horizontal arrow (for the effects of beats per minute and interaction) and on the right side of the figure (for comparison between HFNEF and controls).

