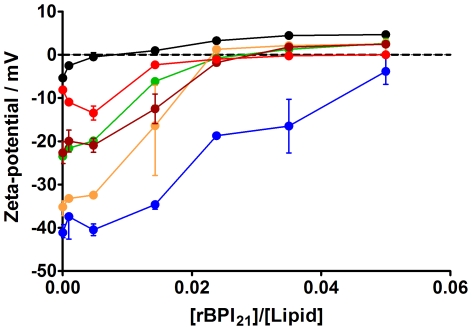
Figure 5. Zeta-potential for membrane model systems in the presence of rBPI21.
Bars represent the zeta-potential range from at least two independent experiments. POPC (black circles); POPG (blue circles); POPC∶POPG 55∶45 (orange circles); POPC∶POPG 80∶20 (green circles); POPC∶LPS 80∶20 (red circles); POPC∶POPG∶LPS 60∶20∶20 (brown circles). The lipid concentration was kept constant at 200 µM. The differences in potential-zeta for [rBPI21]/[Lipid] = 0.015 were statistically significant for the following data pairs: POPC/POPC∶LPS (80∶20), POPC/POPC∶POPG (80∶20), POPC/POPC∶POPG (55∶45), POPC/POPG, POPC/POPC∶POPG∶LPS (60∶20∶20), POPC∶LPS (80∶20)/POPG; POPC∶POPG (80∶20)/POPG, POPC∶POPG (55∶45)/POPG and POPC∶POPG∶LPS (60∶20∶20)/POPG.

