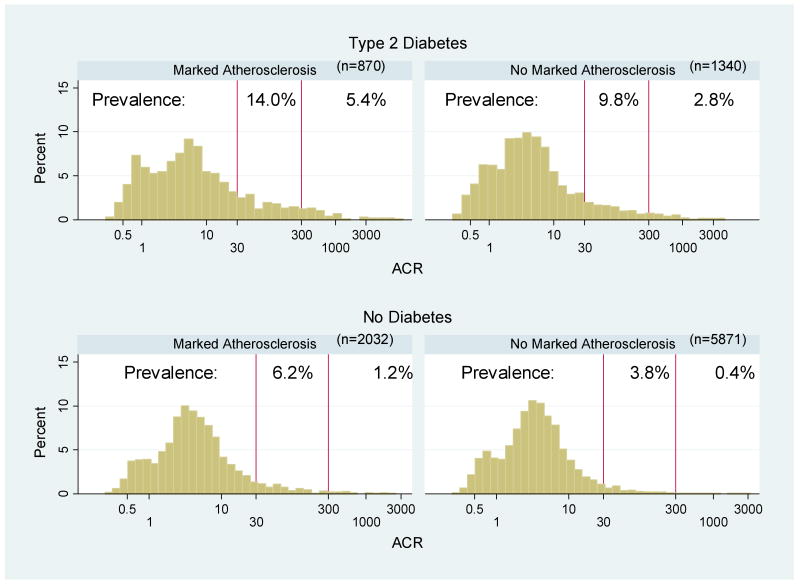
Figure 1.
Distribution of Albumin-to-Creatinine Ratio (ACR) by Presence of Marked Atherosclerosis and Type 2 Diabetes. Marked therosclerosis was defined as prevalent CHD or the upper quartile of the carotid IMT distribution (race, gender, and visit-specific). The distribution of ACR values was graphed on the natural log scale. Vertical lines correspond to cut-offs for microalbuminuria (30μg/mg) and macroalbuminuria (300μg/mg). Prevalence (%) of microalbuminuria and macroalbuminuria within each risk category is noted.

