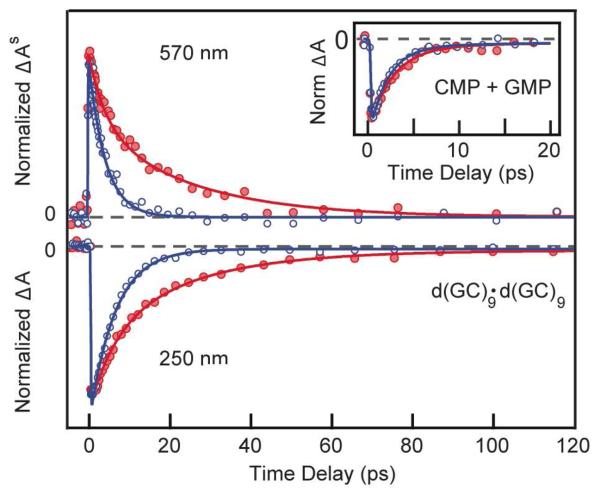
Figure 1.
Normalized transient absorption signals showing excited-state absorption (upper panel) and ground-state bleach recovery (lower panel) of d(GC)9·d(GC)9 in H2O (blue circles) and D2O (red circles). The inset shows the 250 nm transient for an equimolar mixture of the monomers CMP and GMP in H2O (blue circles) and D2O (red circles). Signals at 570 nm were corrected for solvated electrons using the procedure described previously.2 Solid curves are nonlinear least-squares fits to the data points.

