
Fig. 2.
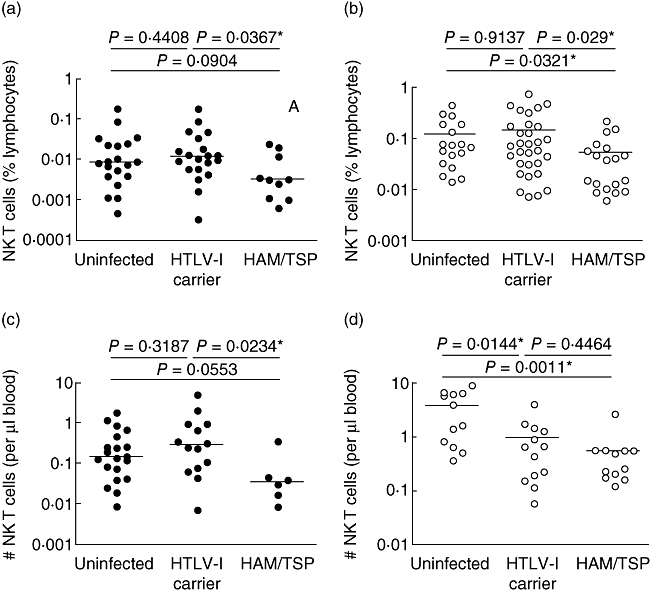
Proportion of natural killer T (NK T) cells in patients and controls. The NK T cell frequencies of three subject groups is shown from the American cohort (a) (black dots) and Brazilian cohort (b) (white dots). Absolute numbers of NK T cells for the American cohort (c) (black dots) and Brazilian cohort (d) (white dots).