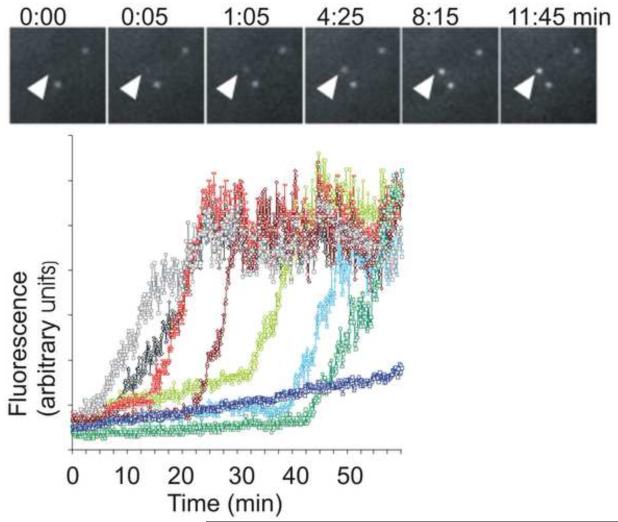
Fig 2. Gag-GFP fluorescence plots to track appearance of HIV-1 at the cell surface.
A. A series of images of three puncta over time. B. Quantification of the fluorescence intensity in seven different puncta over time. Each spot of Gag-GFP fluorescence takes a stereotypic amount of time to reach its steady state which is consistent across different cells. HIV-Gag-GFP synthesized in the cell accumulates at the plasma membrane. As a critical concentration is reached, the Gag forms into discrete puncta at the surface. [from: Jouvenet, 2008].

