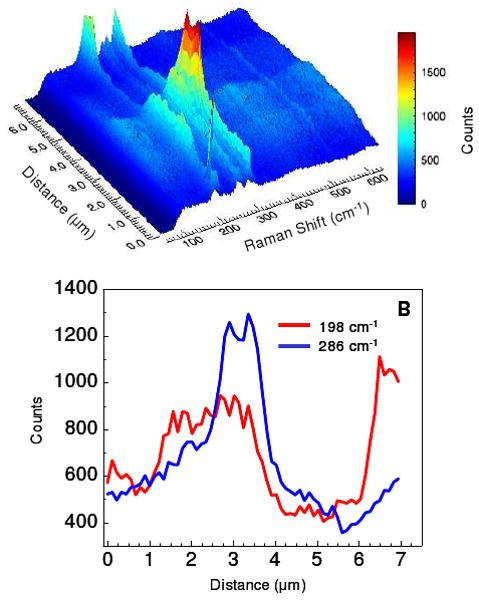
Figure 5.

The radial polarized Raman spectrum, observed in the frequency region corresponding to the radial breathing modes of carbon nanotubes and probed along the diagonal profile in figure 3B, is plotted in A. The Raman intensity profiles at 198 and 286 cm-1, corresponding to 12 and 8 Å nanotubes respectively, shown in B illustrate the spatial heterogeneity of the nanotubes.
