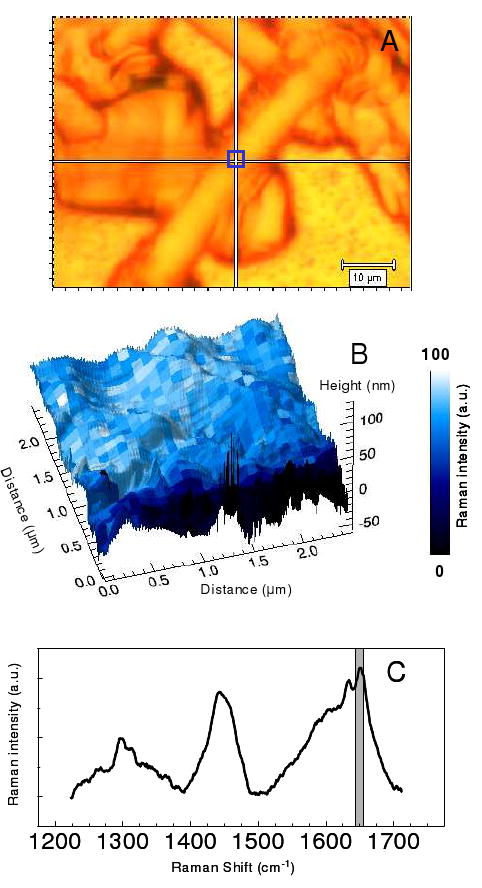
Figure 6.

The visible image of a rod photoreceptor cell is shown in A. The 2.5 μm × 2.5 μm blue box in A corresponds to the combined AFM topography – Raman Intensity plot (B). In B the baseline corrected intensity of the 1655 cm-1 band (C, grey box) is shown to vary on the size of the map pixels, 97 nm.
