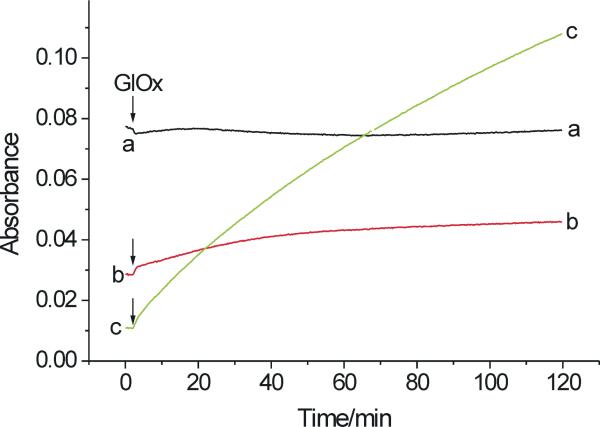
Figure 10.
Oxidation of salbutamol by LPO and H2O2 (generated by glucose and glucose oxidase) at pH 7.0. The sample contained salbutamol (100 μM), LPO (0.7 μM) and glucose (1 mM) and the reaction was initiated by the addition of glucose oxidase (0.1 μg/mL) as the last component (arrow). Traces a, b, and c correspond to absorption changes at 412 nm, 430 nm, and 315 nm, respectively. GlOx designates glucose oxidase. Data points were collected in 15 s intervals.

