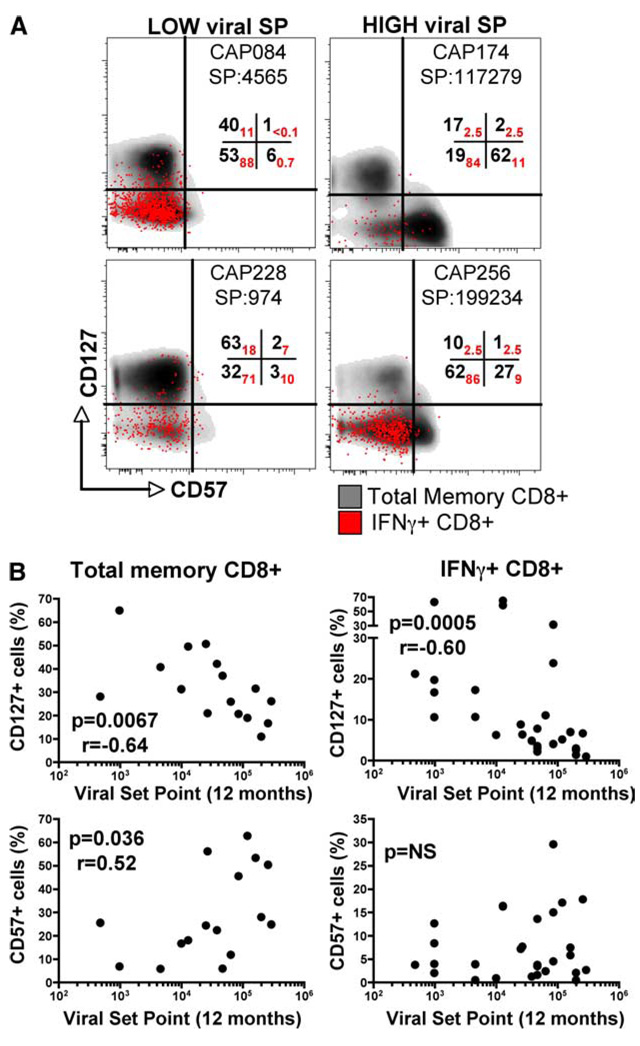
FIGURE 6.
Phenotypic expression of CD57 and CD127 on total memory and HIV-specific CD8+ memory subpopulations. A, Representative CD127 vs CD57 density plots depicting total memory (gray) with overlayed IFN-γ+CD8+ T cells (red dots) in two study individuals with a low 12 mo viral set point (left panels) and two individuals with a high viral set point (right panels). Numbers in the quadrants represent the percentage of CD127+CD57−, CD127+CD57+, CD127+ CD57−, and CD127−CD57+ cells in total memory CD8+ T cells (in black) and in IFN-γ+CD8+ T cells (in red). Patient identification numbers and viral set point (SP) at 12 mo are shown. B, Correlation of the percentage of CD127+ and CD57+ cells in total memory (left panel) and IFN-γ+CD8+ T cells (right panel) at 6–9 mo postinfection with viral set point at 12 mo postinfection. Statistical associations were determined using two-tailed nonparametric Spearman rank correlation.

