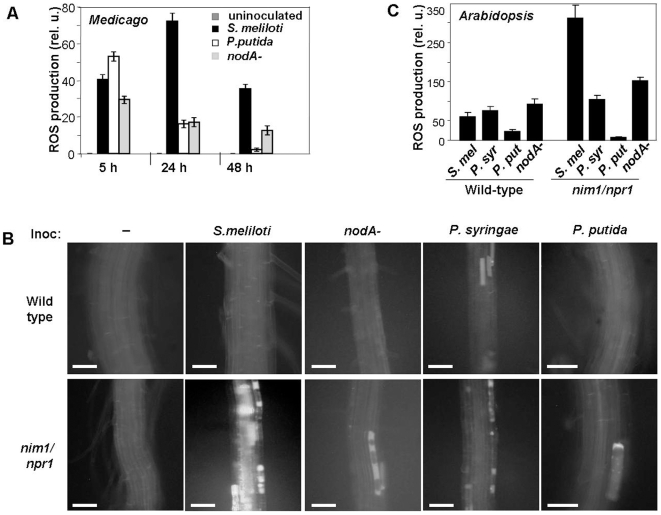
Figure 4. Accumulation of reactive oxygen species (ROS) in roots of Medicago and of wild-type and nim1/npr1 Arabidopsis seedlings, inoculated with S. meliloti, P. putida, or P. syringae.
(A) Roots of 6 day-old M. truncatula seedlings were inoculated with wild-type or nodA mutant S. meliloti, or with P. putida. ROS production was assayed 5, 24 and 48 hours after inoculation by epi-fluorescent microscopy with 2′,7′-dichlorodihydrofluorescein diacetate and narrow-band GFP filter (Ex 485±10 nm/Em 525±10 nm). ROS production in uninoculated roots was below detection level (left bar space in each group). P. syringae inoculation produced similar result as P. putida (not shown). Error bars indicate standard deviation of the mean (N = 12). (B) Roots of nine day-old wild-type or nim1/npr1 A. thaliana seedlings were inoculated with wild-type or nodA, or nodH (not shown) mutant S. meliloti, P. putida, or P. syringae. ROS production was assayed 24 hours after inoculation by epi-fluorescent microscopy with 2′,7′-dichlorodihydrofluorescein diacetate and a narrow-band GFP filter (Ex 485±10 nm/Em 525±10 nm). All samples were analyzed using identical exposure conditions. Fluorescence from npr1 plants inoculated with S. meliloti nodH− mutant was even below uninoculated control (data not shown). Shown are representative A. thaliana roots images from four similar experiments 24 hours after inoculation. Bar = 125 µm. (C) Quantitation of ROS production in A. thaliana roots, 24 hours after inoculation with wild-type S. meliloti (S.mel), nodA mutants (nodA−), P. syringae (P.syr) or P. putida (P. put). ROS were quantified using ImagePro Plus software package. Error bars indicate standard deviation of the mean (N = 12).

