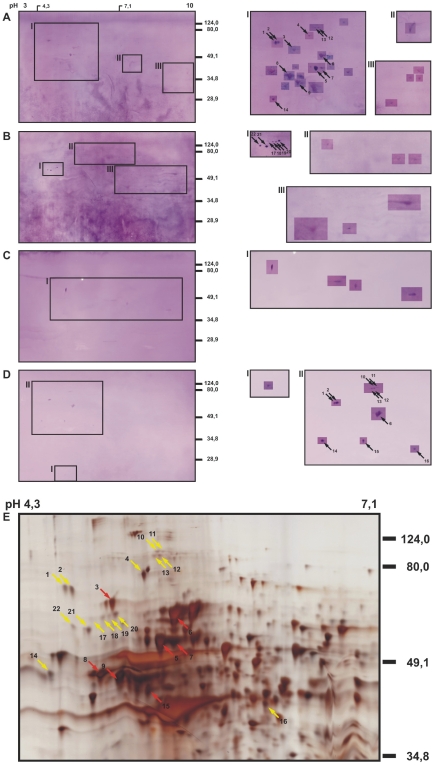
Figure 2. Seroreactivities of patients with cutaneous lymphoma against the mycosis fungoides cell line MyLa.
Total protein extracts of MyLa cells were separated by 2-dimensional electrophoresis with an isoelectric focusing pH range of 3–10 in the first and SDS-PAGE in the second dimension, blotted onto nitrocellulose membranes and probed with the sera of the patients as listed in Table 1. Serum dilutions were 1/200. The blots A and B were probed with 8 different sera each, blots C and D with single sera. Antigens were detected in the boxed regions of the gels. The antigen signals were very weak although high concentrations of the sera were used which caused a relatively high background of the blots. To enhance the visibility of the spots, the contrast of the image areas around the spots was intensified. For every Western blot analysis A through D, the original is shown on the left and the regions with the enhanced spots for the regions indicated with Roman numerals on the right. A silver-stained gel of the MyLa proteome corresponding to the Western blots A–D is shown in E. The antigen spots that could be assigned to protein spots in the silver-stained gel are indicated with arrows and numbered.

