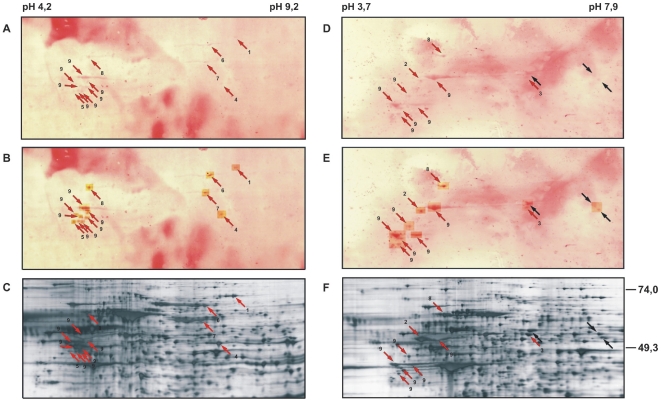
Figure 4. Seroreactivities of patients with mycosis fungoides against autologous tumor cells.
Protein extracts of tumor cells of patient 85 (panels A–C) and patient 86 (panels D–F) were separated by 2-dimensional electrophoresis with a pH range of 3–10 for isoelectric focusing in the first and SDS-PAGE in the second dimension. The proteins were blotted onto nitrocellulose and probed with the respective sera (panels A and D) or visualized by silver staining in replica gels (panels C and F). Since the antigen reactivities are weak and their visibility further reduced by the high background which is due to the high serum concentrations that had to be used for antigen detection, the antigen spots were enhanced by image processing (panels B and E). Antigen spots that could be assigned to protein spots in the silver-stained gels are indicated with arrows and numbered.

