Fig. 1.
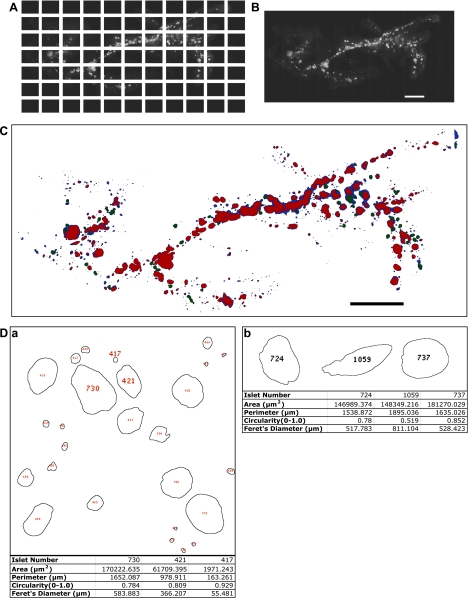
Quantitative optical image analysis of the entire distribution of pancreatic islets in the intact adult pancreas. A: a series of contiguous images of a specimen was taken using a ×2 objective (a male RIP-Tag mouse at 15 wk). Note a mosaic image covering the entire distribution of islets, including small clusters of β-cells (<10 cells). B: a virtual slice that combines all the images into a single image montage. The dorsal pancreas is on the right and the ventral pancreas is on the left. Scale bar, 5 mm. C: mask rendering of fluorescing particles. Color codes are as follows: blue, low-intensity fluorescence; green, intermediate-intensity fluorescence; red, high-intensity fluorescence. Scale bar, 5 mm. D: quantification of each islet/small cluster of β-cells. Note that each islet (including small clusters of β-cells) is identified and numbered, which corresponds to individual information listed in a tab-delimited text file by a programmed macro using ImageJ. a: 4 parameters were recorded on each structure: 1) area; 2) perimeter, distance surrounding an area; 3) circularity, degree of roundness where 1.0 depicts a perfect circle; 4) Feret's diameter, longest distance within an area. Note: #417 with area of 1,971 μm2, for example, represents the resolution of the analysis, which is equivalent to only a few β-cells. b: islet shape, defined by a combination of parameters. Shape of an individual islet can be determined by using parameters of perimeter, circularity, and Feret's diameter. Three islets (#724, #1059, and #737) are similar in area; however, #1059 shows a distinct shape, which reflects a longer perimeter, longer Feret's diameter, and low number in circularity compared with those of #724 and #737.

