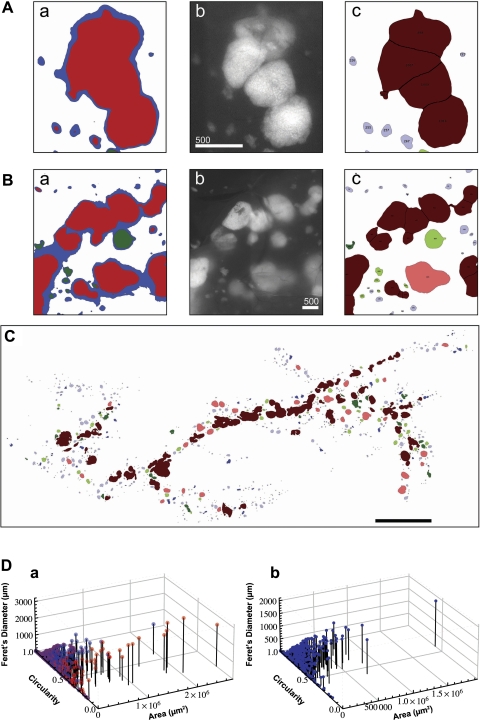
Fig. 2.
Application of watershed segmentation. A: representative false capture of multiple objectives as one structure. a: closely residing islets are prone to be captured as a continuous structure in a large-scale optical image analysis. b: a corresponding fluorescent image shows that there are multiple islets within a single cluster recorded in a. Scale bar, 500 μm. c: watershed segmentation recognized each islet structure and divided it into 4 islets. B: representative false capture of low-intensity fluorescent light scattering. a: a low-intensity mask (blue) captures β-cell clusters and small islets accurately but falsely interconnects larger fluorescent particles prone to light scattering by surrounding tissue. b: original image of fluorescing islets and β-cell clusters. Scale bar, 500 μm. c: results of particle analysis after size exclusion filters correspond closely to captured fluorescent particles in b. C: outline rendering of particle analysis. Color codes are as follows: light blue, small islets and β-cell clusters (≤1 × 105 μm2 with circularity >0.7); dark blue, islets (≤1 × 105 μm2 with circularity >0.7) subject to watershed segmentation; light red, large islets (≥1 × 105 μm2 with circularity >0.7); dark red, islets (>1 × 105 μm2 with circularity ≤0.7) that were segmented; and light green, islets (≅1 × 105 μm2 with circularity ≤0.7) that were excluded, because an increased threshold decreases the measured area; dark green, islets (≅1 × 105 μm2 with circularity ≤0.7). Scale bar, 5 mm. D: Three-dimensional scatter plot showing size and shape distribution of each islet. a: comparison of pre-watershed (red) and post-watershed (blue) is shown. b: post-watershed data plotted alone.

