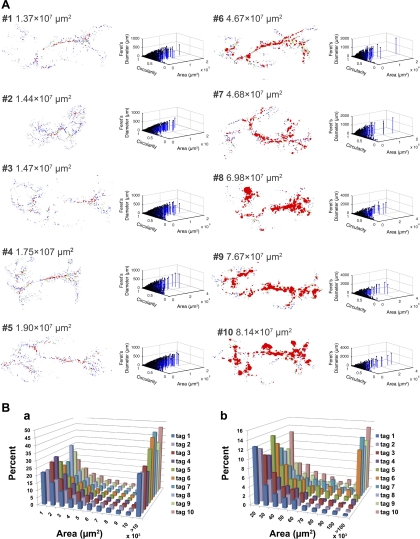
Fig. 3.
Progressive development of insulinoma in RIP-Tag mice. A: representative stages of insulinoma development are shown in order of increasing β-cell area. Dorsal pancreas is on the right, and ventral pancreas is on the left. All males. #1: pancreas from a wild-type mouse at 12 wk as a control; #2–#10 RIP-Tag mice (#2: 4 wk; #3 and 4: 8 wk; #5: 10 wk; #6 and 7: 15 wk; #8–10: 20 wk. NB: #6 specimen was used as a model in Figs 1 and 2). A series of outline renderings of particle analyses (left) demonstrates progressive β-cell tumor growth in situ. Corresponding 3-D scatter plots of islet parameters depict distribution of islets with various sizes and shapes (right). B: histogram showing distribution of islets. a: distribution of total β-cell area is shown in increments of 1 × 103 μm2. Note that β-cell area >10 × 103 μm2 is compiled in the last column. b: β-cell area >10 × 103 μm2 shown in Aa is partitioned in increments of 10 × 103 μm2. Note difference in frequency (y-axis) from histogram shown in Ba.

