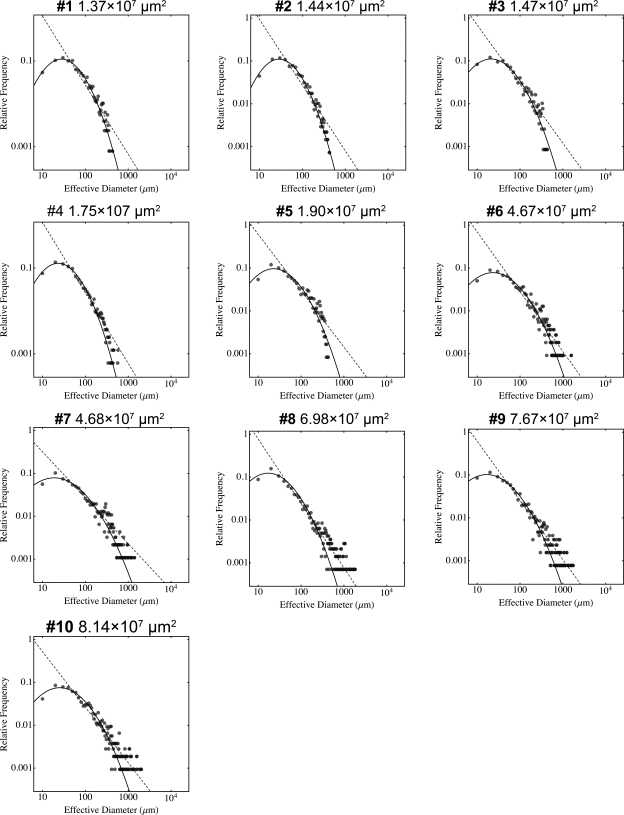
Fig. 4.
Mathematical analysis of insulinoma progression. Log plots of distribution of β-cell area at each stage of developing insulinoma. The numerical value of each β-cell area is converted to an effective diameter s (a parameter that depicts the same area of a perfect circle) and is plotted as scattered dots. Note that overall growth of β-cells fit into a log normal function, where with substantial tumor development (at #6 and thereafter) the distribution of islets >1,000 μm in effective diameter falls off from the curve with a rightward shift and rather fits a power law distribution (dashed line), suggesting unregulated tumor growth.

