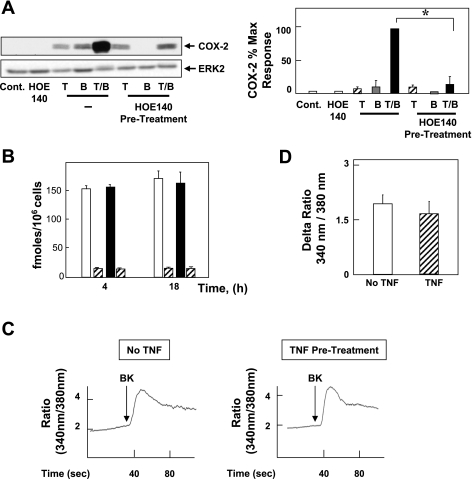
Fig. 3.
BK induces COX-2 expression via constitutive B2 receptor; TNF-α does not affect [3H]BK binding or BK-mediated intracellular Ca2+ concentration ([Ca2+]i). A: 18Co cells were pretreated with or without the B2 receptor-specific antagonist HOE-140 (10 μM) for 1 h before stimulation with 8.3 ng/ml TNF-α, 100 nM BK, or both for 6 h, as indicated. Cell lysates were analyzed by SDS-PAGE and Western blot using anti-COX-2 antibody. Result shown is a representative autoluminogram; similar results were obtained in 3 independent experiments. COX-2 expression was quantified by densitometric scanning. Results shown are means ± SE (n = 3) and are expressed as % of maximum level of COX-2 expression. Equal protein loading was verified with an antibody that detects ERK2. *Statistical significance (P < 0.05). B: 18Co cells were incubated either in the absence (open bars) or in the presence (filled bars) of 8.3 ng/ml TNF-α for either 4 h or 18 h Cells were washed twice with phosphate-buffered saline (PBS) containing 1 mg/ml bovine serum albumin and 20 mM HEPES, pH 7.2 (binding buffer) and incubated for 1 h at 4°C in this binding buffer containing [3H]BK (4 nM, 4 pmol/ml). Nonspecific binding (hatched bars) was determined in the presence of 10 μM unlabeled BK. The incubation was terminated by washing the dishes 5 times with ice-cold binding buffer. After extraction with a solution containing 0.1 M NaOH and 1% SDS, radioactivity was measured by liquid scintillation counting. C: BK (100 nM, indicated by arrow) was added to fura-loaded 18Co cells, and increase in [Ca2+]i was monitored as described in materials and methods for untreated cells (left) and cells preincubated with 8.3 ng/ml TNF-α for 4 h (right). Tracings are representative of 5 separate experiments. D: peak, maximal increment in [Ca2+]i in response to BK (100 nM) in cells incubated without (open bars) or with (hatched bars) 8.3 ng/ml TNF-α for 4 h before BK stimulation.

