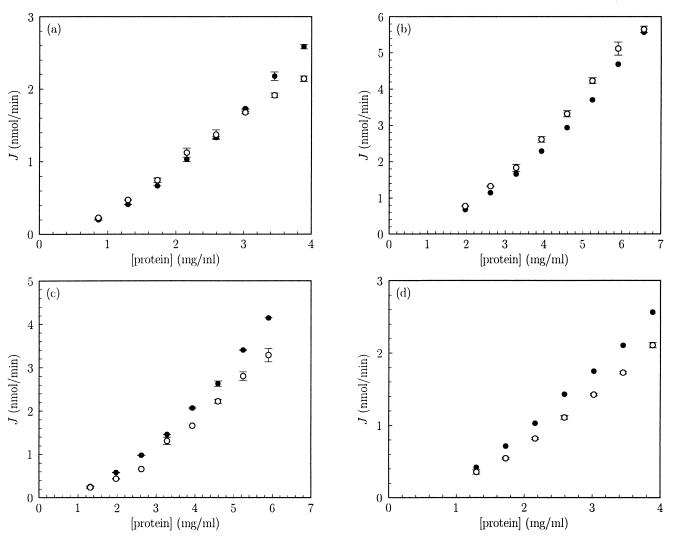
Figure 1.
Dependence of PTS flux in vitro on the total protein concentration. The rate of MeGlc phosphorylation by cell-free extracts of E. coli was determined as described in the text. Closed symbols refer to fluxes without extra assay additions. Open symbols refer to fluxes under identical conditions, except that the assay mixture contained, additionally, 9% (m/V) PEG 6000 (a), 4.5% (m/V) PEG 6000 (b), 5% (m/V) PEG 35000 (c), and 1.2 M glycerol (d). Data points reflect means of two independent experiments, except the experiments depicted by the closed symbols in b and d, in which each data point reflects an individual determination. Error bars indicate SEMs. Experiments a–d were performed with different cell-free extracts. The control experiment (closed symbols) was always included as a reference.

