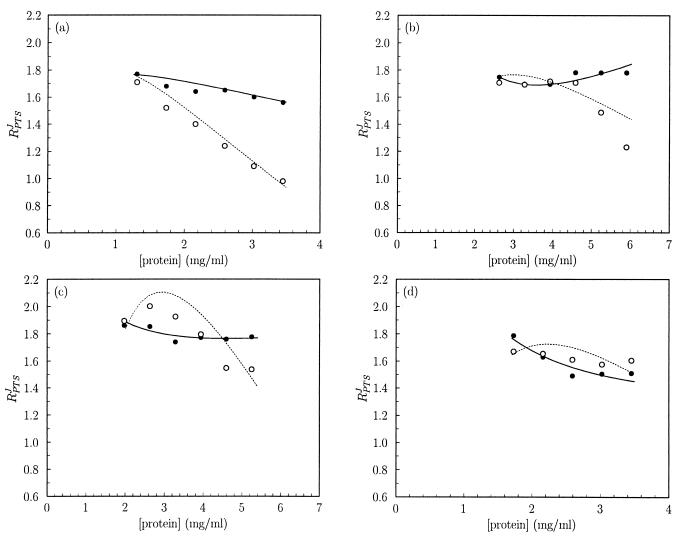
Figure 2.
The effect of PEG 6000, PEG 35000, and glycerol on the combined flux–response coefficient of the PTS enzymes in vitro. The data from Fig. 1 were differentiated and scaled to determine RPTSJ as described in the text. The lines refer to slopes calculated by the first derivative of a third-order polynomial fitted through the flux vs. protein concentration data in double-logarithmic space. The points refer to scaled slopes determined by fitting a cubic spline through the flux vs. protein concentration data in linear space. Solid lines and closed symbols refer to assays without extra additions. Dotted lines and open symbols refer to assays with the following extra additions, as in Fig. 1: 9% (m/V) PEG 6000 (a), 4.5% (m/V) PEG 6000 (b), 5% (m/V) PEG 35000 (c), and 1.2 M glycerol (d).

