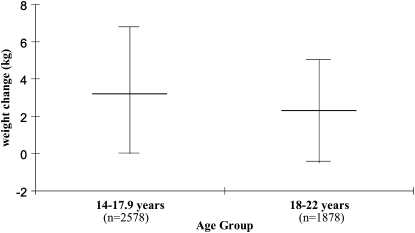
FIGURE 2.
Distribution (25th, 50th, and 75th percentiles) of weight change over 4 y among adolescent and young adult females in the Growing Up Today Study. Middle bar indicates the median weight change, the upper bound equals the 75th percentile, and the lower bound equals the 25th percentile of weight change over 4 y.

