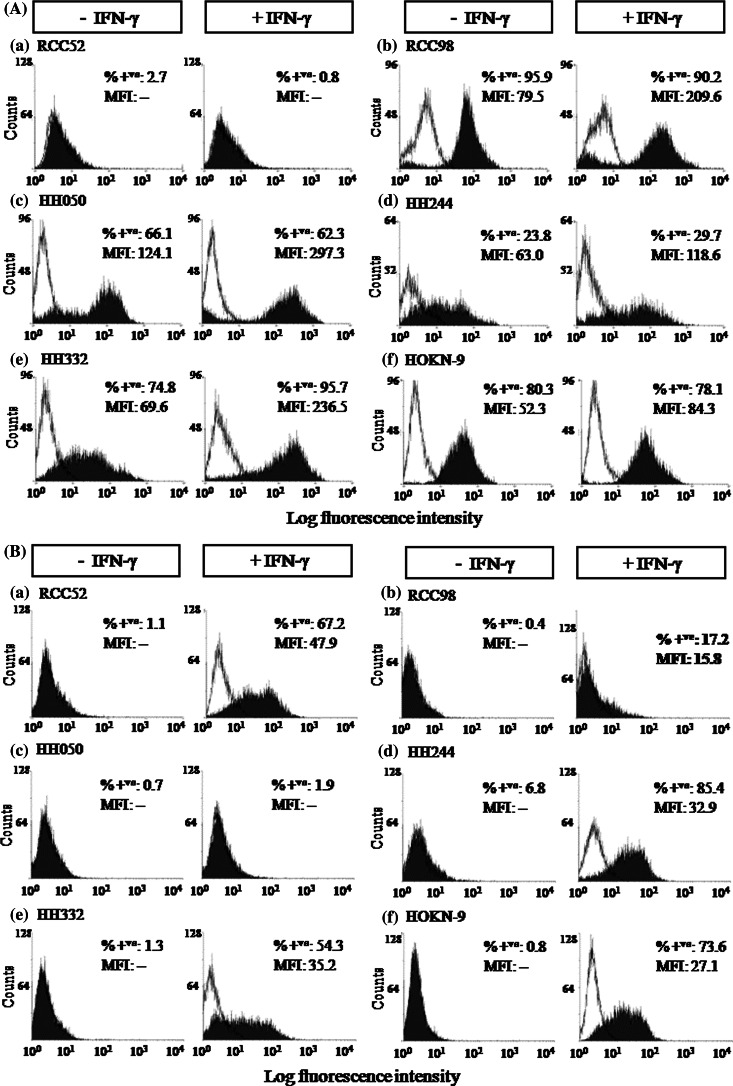
Fig. 1.
Differential surface HLA class I (a) and HLA class II (b) antigen expression on the RCC cell lines, RCC52 (a) RCC98 (b) HH050 (c) HH244 (d) HH332 (e) and HOKN-9 (f) under basal conditions (−IFN-γ) and following incubation with IFN-γ (300 U/ml) at 37°C for 48 h (+IFN-γ) in vitro. The results presented in the histograms were determined by cytofluorometric analysis of cells stained with HLA class I antigen-specific mAb W6/32 and with HLA class II antigen-specific mAb LGII-612.14. Experiments were repeated three times with each cell line; similar results were obtained

