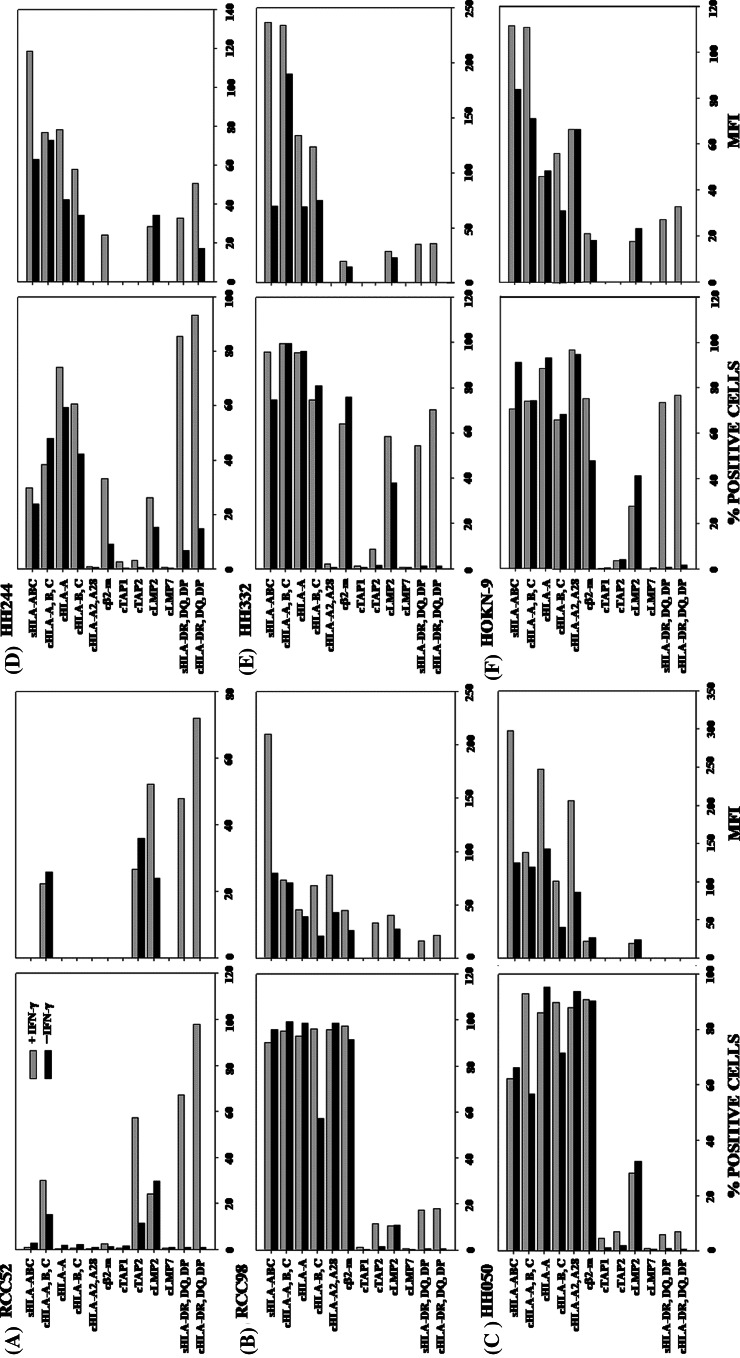
Fig. 2.
HLA class I and APM components expression by RCC cell lines a RCC52, b RCC98, c HH050, d HH244, e HH332 and f HOKN-9. Cells were incubated at 37°C for 48 h with or without IFN-γ (300 U/ml). Surface and intracellular expression of the molecules was determined by cytofluorometric analysis. Results are expressed as % stained cells on the left frame and mean fluorescence intensity (MFI) on the right frame. The symbols “s” and “c” at the prefix of the indicated antigen stand for surface and cytoplasmic antigens, respectively. *HC stands for HLA heavy chains. The values of MFI are not indicated, when the stained cells is less than 10%

