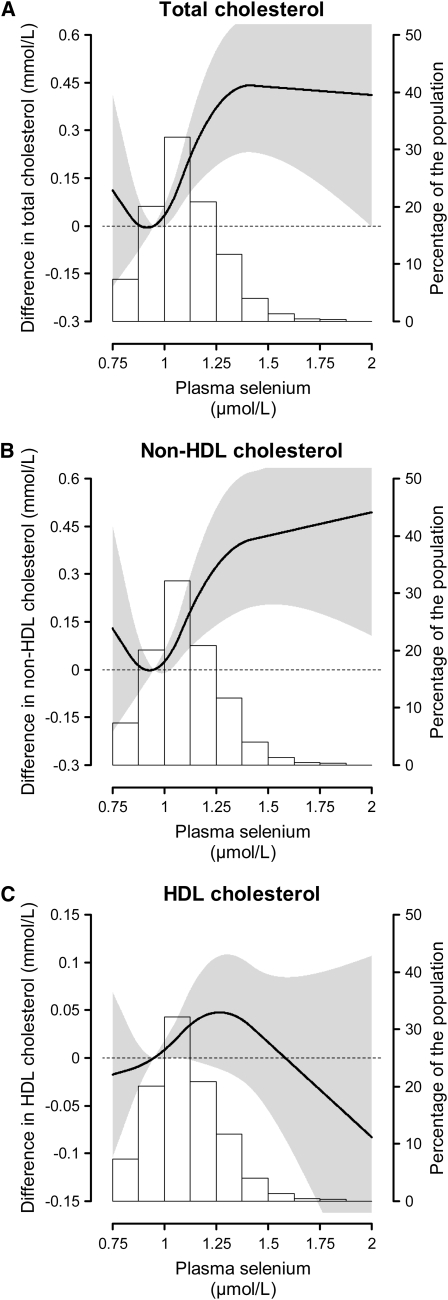
FIGURE 1 .
Adjusted differences (95% CI) in lipid fraction concentrations by plasma selenium, in the 2000–2001 UK NDNS. The curves (read in the scale to the left) represent the adjusted differences (and the gray shading, the 95% CI) in lipids of subjects with any given value of plasma selenium with respect to a subject with 0.95 μmol/L of plasma selenium (plasma selenium at the 20th percentile, which was used as reference). The differences are statistically significant for all the range where the gray shading does not include the dashed reference line that denotes a zero difference. Plasma selenium was modeled as restricted quadratic splines with nodes at the 5th, 50th, and 95th percentiles. Multivariable linear regression models were adjusted for age, sex, BMI, smoking status, daily cigarette consumption, daily alcoholic drinking units, daily physical activity score, household income group, educational level group, employment status, daily food energy, total fat intake, total cholesterol intake, polyunsaturated-to-saturated fatty acid ratio, vitamin/mineral supplement use, oral contraceptive use, and hormone replacement therapy. The histogram (read in the scale to the right) shows the distribution of plasma selenium in the study population.

