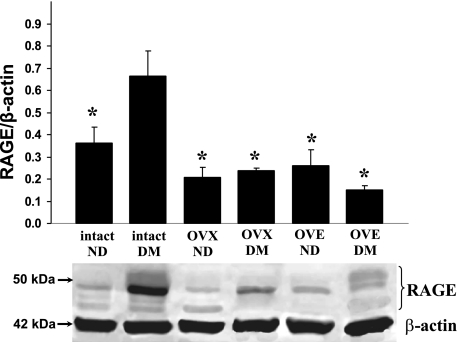
Fig. 3.
Representative Western immunoblots depicting RAGE (∼50-kDa bands) and β-actin (∼42-kDa bands) expression (bottom) along with RAGE band intensities expressed relative to β-actin (top) in samples obtained from the superficial cerebral cortex are shown. The groups are nondiabetic (ND) and diabetic mellitus (DM) intact female rats (n = 6 for both), ND and DM OVX female rats (n = 4 and 6, respectively), and ND and DM OVE rats (n = 5 and 6, respectively). For RAGE measurements, all bands between 45 and 55 kDa were included in the analysis. Values are means ± SE. *P < 0.05 vs. intact DM.

