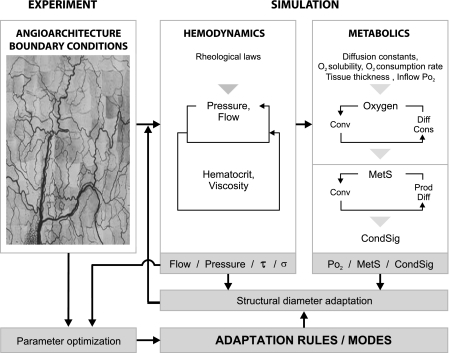
Fig. 3.
Simulation of structural diameter adaptation. Experimental data on network structure and rheological laws are used to simulate blood flow, transmural pressure, hematocrit, and viscosity for each vessel segment. Oxygen distribution in the vascular network and the tissue is estimated via an iterative loop, alternately calculating oxygen convection (Conv) in the network and oxygen diffusion (Diff) and consumption (Cons) in the tissue. The adaptation model is shown with shaded background. A metabolic signaling substance (MetS) is produced (Prod), dependent on the calculated local oxygen level, according to the selected mode (tissue signaling, wall signaling, RBC signaling) and undergoes diffusion and convection. Vascular concentration of MetS leads to the generation of a signal that is conducted upstream (CondSig) along flow pathways. Stimuli derived from hemodynamic conditions (flow, pressure, wall shear stress τ, and wall stress σ) and metabolic conditions determine diameter adaptation for each vessel segment, according to an assumed set of adaptation rules. Comparison of simulated with experimental network data is performed to optimize parameters used in the adaptation.

