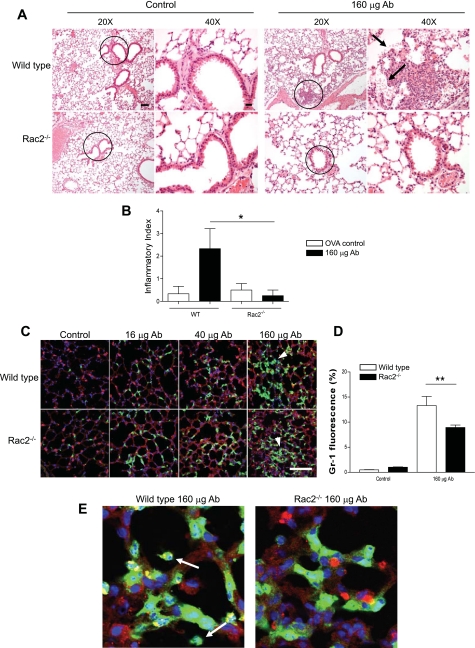
Fig. 2.
Neutrophil recruitment to lung parenchyma in WT and rac2−/− mice with ALI. A: lungs stained with hematoxylin and eosin (H&E) from WT and rac2−/− mice exhibited similar increases in leukocyte infiltration following administration of 160 μg of anti-ovalbumin, although alveolar hemorrhage was more prominent in WT lungs (arrows). The circles indicate the regions shown at higher magnification at right. Scale bars: low magnification, 50 μm; high magnification, 20 μm. B: quantitative histology of H&E-stained lung sections, carried out in blinded, unbiased analysis. Bar graph shows means ± SE of sections of lung measuring ≥200 mm2 (3–4 mice per condition). C: immunofluorescence of lung sections from mice treated with increasing doses of anti-ovalbumin. Sections were stained for the neutrophil marker Gr-1 (green) shown in combination with the epithelial cell marker surfactant protein C (SP-C; red) and counterstained with nuclear marker 4′,6′-diamidino-2-phenylindole (DAPI; blue). Scale bar, 100 μm. Arrowheads indicate clusters of interstitial neutrophils. D: percentage of Gr-1 fluorescence obtained from WT and rac2−/− mice in response to immune complexes. Average fluorescent percentages were obtained from 10 randomly selected fields from lung sections, and green fluorescence (Gr-1+ cells) was quantified using the Olympus FluoView confocal software program (n = 3 mice). *P < 0.05; **P < 0.01. E: higher magnification of images shown in B indicating extravasation of neutrophils (arrows) into alveolar spaces in WT but not rac2−/− lungs with ALI. OVA, ovalbumin.

