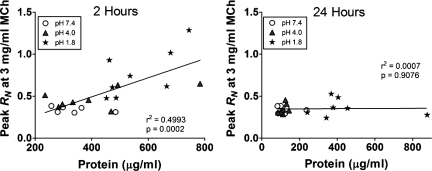
Fig. 6.
Individual values for BALF protein levels (μg/ml), plotted against peak RN following low-dose MCh aerosol exposure (3 mg/ml) from mice aspirating saline at pH 7.4 (shaded circles), pH 4.0 (shaded triangles), and pH 1.8 (filled stars). Groups from 2-h time point are plotted on left and from 24-h time point are plotted on right. Correlation coefficient (r2) and P values are listed at bottom right of each panel.

