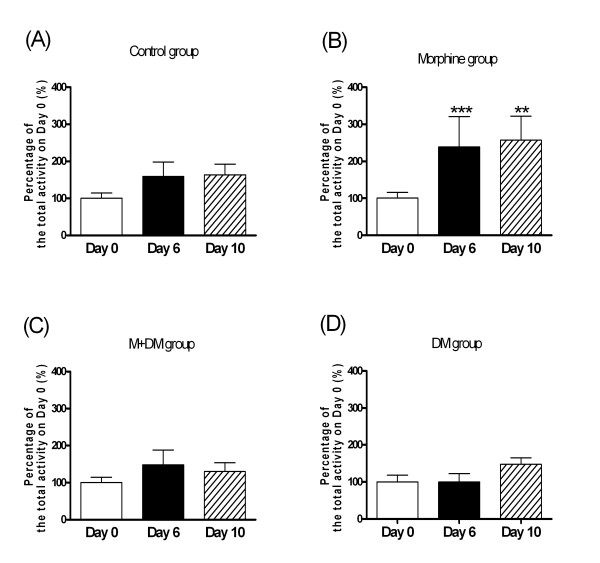
Figure 3.
Effects of morphine (1 mg/kg) on behavioral sensitization of total locomotor activity in the male offspring rats (p60) from different groups (A: Control group; B: Morphine group; C: M + DM group; D: DM group). Data were presented as mean ± SEM. Student t-test was used to analyze the data for the significance of the difference from the activity on day 0 (**p < 0.01, ***p < 0.001 compared with the data on day 0; n ≧ 7).

