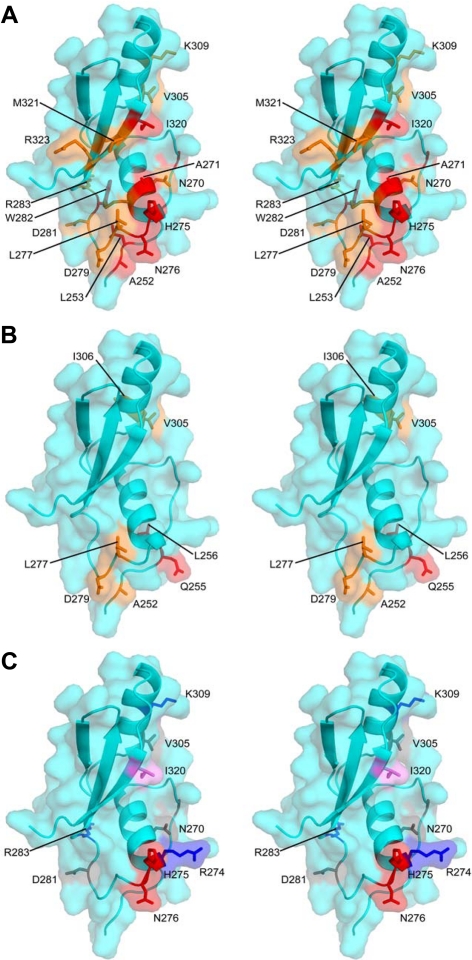
Figure 6.
Mapping Ste50p-RA domain surface residues for Opy2p interaction and their function in HOG pathway regulation described in Table 1 onto the structure of the Ste50p-RA domain. (A and B) Residues most affected in NMR experiments by binding of the sOPY2p and fOPY2p peptides, respectively. The most affected residues are in red, moderately affected in orange. (C) Residues mutated and functionally characterized as summarized in Table 1 are displayed as gray (mutation with no defect in the HOG pathway as compared with the wt Ste50p); red (mutations with defect in the HOG pathway signaling specifically through the Opy2p-FID (=ΔSID); blue (mutations with defect in the HOG pathway signaling specifically through the Opy2p-SID (=ΔFID); and violet (mutations defective in the HOG pathway signaling even with the wt Opy2p).

