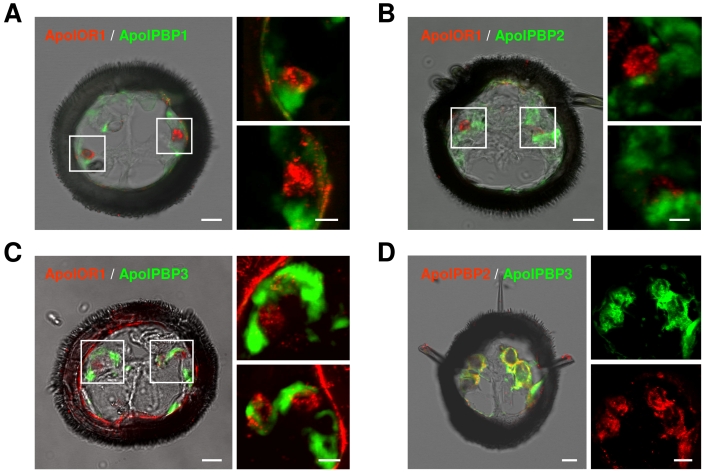
Fig 4.
Expression of ApolOR1 and ApolPBPs in the A. polyphemus antenna. Double in situ hybridizations were performed with combinations of DIG-labeled and biotin-labeled antisense RNA probes on cross sections through male antennal side branches. Hybridization of probes was visualized by detection systems leading to red (DIG-label) or green (biotin-label) fluorescence. (A-C) Hybridizations using combinations of ApolOR1 and ApolPBP probes. (A) ApolOR1 and ApolPBP1, (B) ApolOR1 and ApolPBP2, (C) ApolOR1 and ApolPBP3. The images to the left represent selected pictures taken from stacks of optical sections and show an overlay of the red and green fluorescence channels and the transmitted-light channel. Scale bars: 10 µm. Higher magnifications of the areas boxed are shown on the right sides, the upper of the two pictures showing the left boxed area and the lower pictures showing the right boxed area. Only the red and green fluorescence channels are shown; images represent projections of stacks of optical sections. Scale bars: 5 µm. (D) Double in situ hybridization with ApolPBP2 (DIG-label) and ApolPBP3 (biotin-label). Depiction as in A-C, details of the left image are displayed on the right (red or green fluorescence channel). Scale bars: 10 µm.

