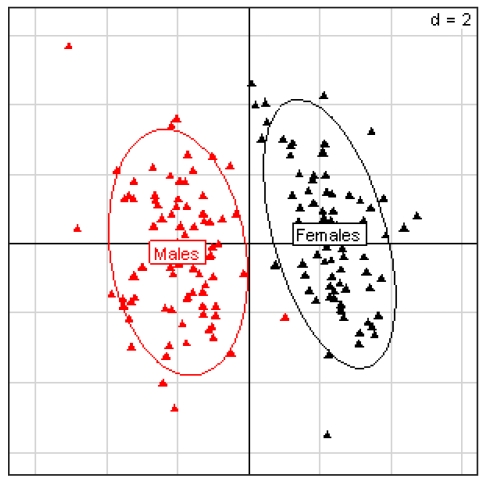
Fig 2.
Principal Component Analysis for kidney parameters of all rats in the NK 603 experiment. The scheme obtained for parameters at week 14 explains 44.78% of the total data variability (inertia) expressed on 2 axes (27.27% for factor 1; 17.51% for factor 2), scale d=2. This demonstrates the clear separation of parameters values according to sex.

