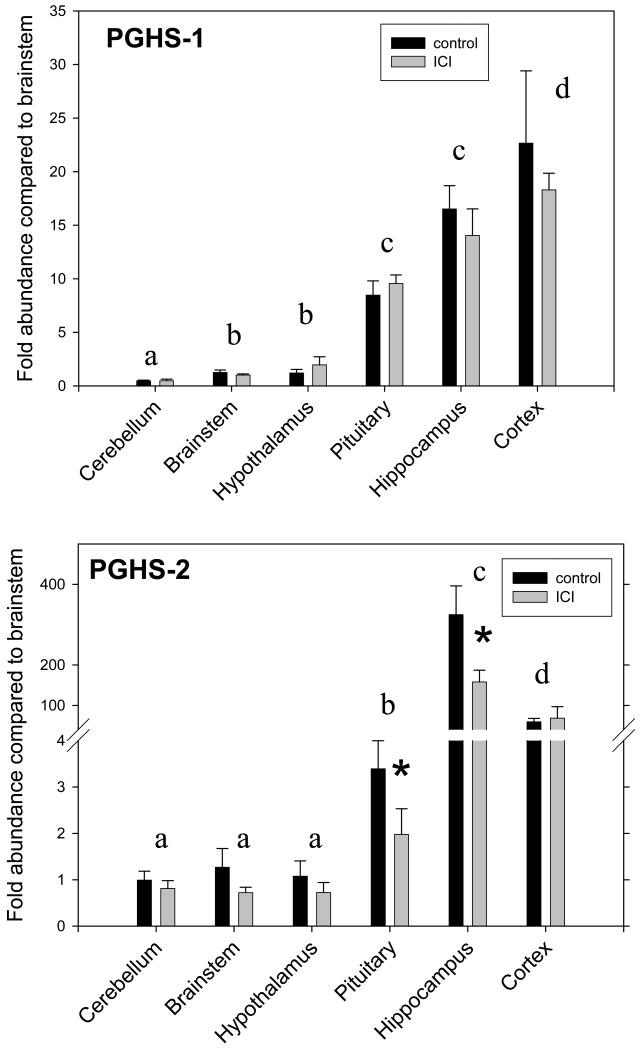
Figure 1.
PGHS-1 (top panel) and PGHS-2 (bottom panel) mRNA abundance in cerebellum, brainstem, hypothalamus, pituitary, hippocampus, and cerebral cortex in twin fetuses treated with 25 μg/day of ICI 182,780 (grey bars, n=6) or vehicle (black bars, n=6). Data are represented as mean±SEM. *, statistically significant difference between groups. Letters appearing over pairs of vertical bars represent significant differences in PGHS-1 and -2 expression among regions. Different letters represent statistically significant differences.

