
Figure 4.
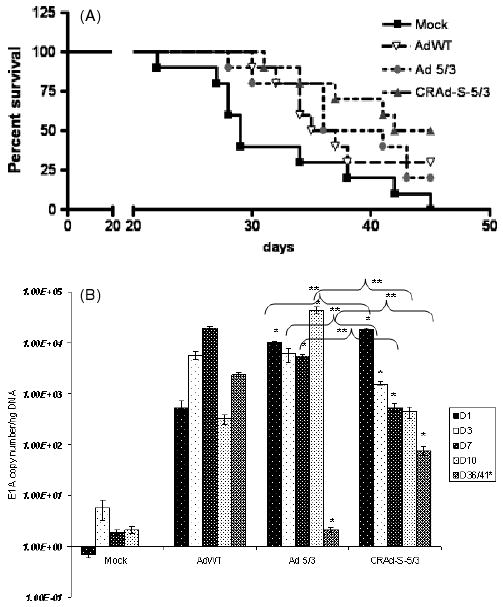
In vivo analysis of CRAd-Survivin-5/3. (A) Survival graph showing different groups days after virus injection. (B) Replication of AdWT, Ad 5/3 and CRAd-Survivin-5/3 in mouse brain tumors. Animals were killed at days shown and total DNA was isolated from the brains. Replication of adenovirus was measured by qPCR. Asterisks (*, **) indicate a statistically significant difference (p < 0.05)at specified time points in gene levels relative to AdWT and Ad 5/3, respectively