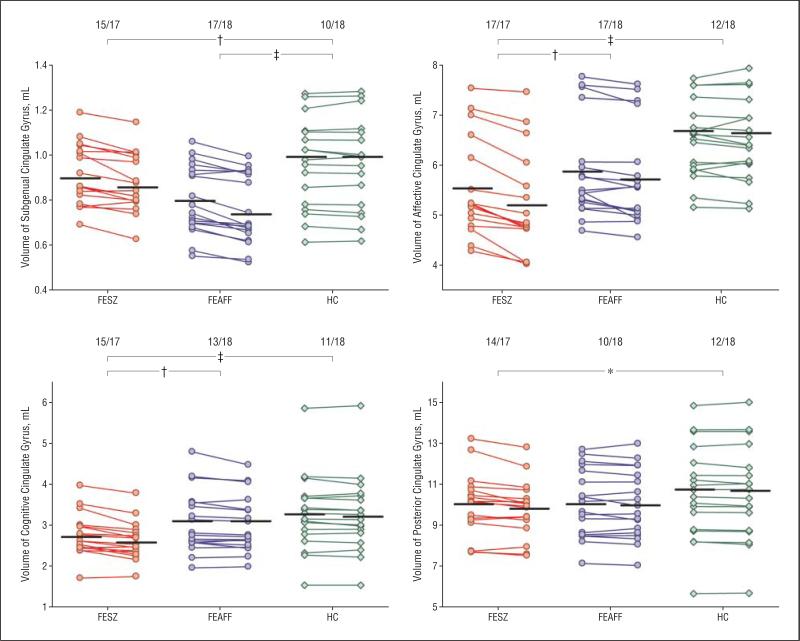
Figure 4.
Volume changes in 1½ years in absolute bilateral (left and right combined) volumes of the cingulate gyrus gray matter at baseline and the second scan in subjects with first-episode schizophrenia (FESZ) (n=17) or first-episode affective psychosis (FEAFF) (n=18) and healthy control subjects (HCs) (n=18). Values of the baseline and second scan in each subject are connected by lines. The numbers at the top of the graphs indicate the proportion of subjects who showed volume reduction over time (number of subjects/total number of subjects). Horizontal lines indicate the mean at the baseline and second scan. *P<.05; †P<.01; ‡P<.001, in comparison of percentages of change between each of the 2 groups by analysis of variance.

