
Figure 6.
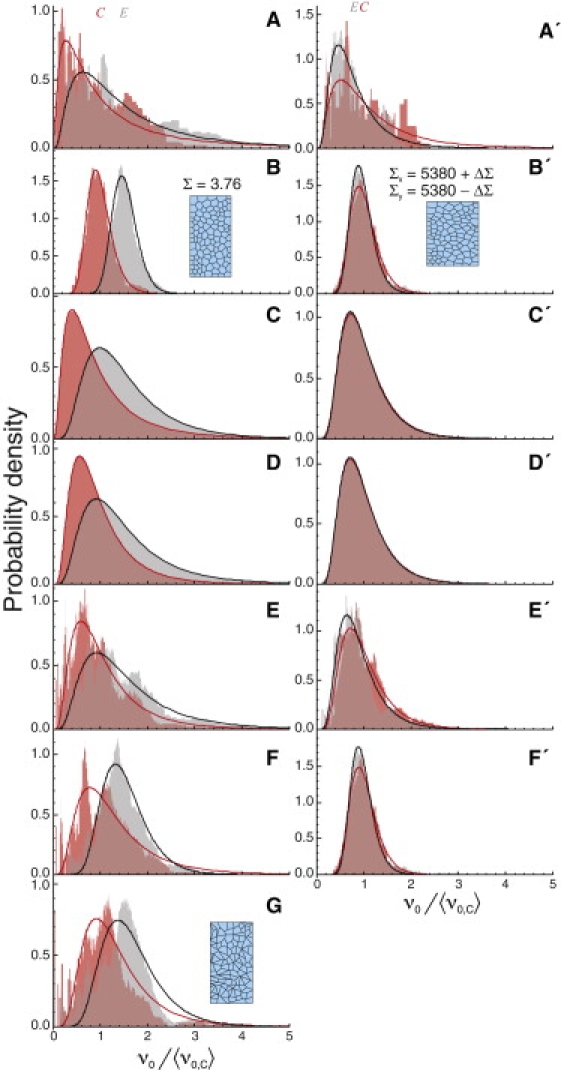
Comparison of ν0-distributions for experiments and simulations: (dark red) cell-center wounds; (light gray) cell-edge wounds; (solid lines) best-fit log-normal distributions. 〈ν0,C〉 and 〈ν0,E〉 are marked by the red C and gray E, respectively. Unprimed labels refer to early dorsal closure, primed to late: (A and A′) experimental recoil velocities; (B and B′) best-matching uniform simulations; (C and C′) addition of interembryo log-normal variations in Σ; (D and D′) addition of interembryo log-normal variations in all force/viscosity ratios; (E and E′) addition of intraembryo log-normal variations in viscosity; (F and F′) nonequilibrium simulations with intraembryo log-normal variations in the interfacial tensions γ; and (G) simulations with intraembryo log-normal variations in γ that were reequilibrated before wounding. The sample patches show the cell geometry after equilibration at the noted stress Σ, including the misshapen cells after reequilibration with variable γ in panel G. For late dorsal closure, similar results with γ < 0 are presented in Fig S3.