
Figure 1.
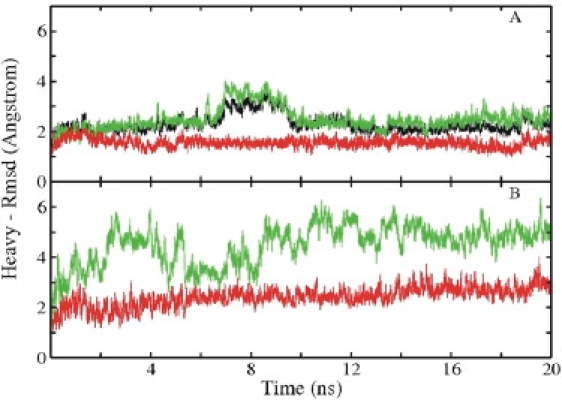
RMSD (heavy atoms) of sampled conformations of complex, peptide, and RNA from the native structure (Protein Data Bank: 1A4T) versus simulation time. (A) RMSD of the N-peptide-boxB RNA complex (black), RNA in complex (red), and peptide in complex (green/light gray) starting from the experimental structure. (B) RMSD of isolated RNA (red/dark gray) and isolated peptide (green/light gray) starting from the experimental structure.