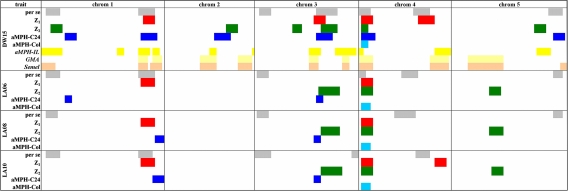
Fig. 3.
Schematic representation of growth related per se and heterotic QTL. QTL positions are indicated by boxes corresponding to the intervals covered by the respective confidence intervals. DW15 Shoot dry weight at 15 DAS, Z 1 augmented additive effect, Z 2 augmented dominance effect, aMPH C24, aMPH Col absolute mid-parent-heterosis in cross with C24 and Col-0, respectively, LAn leaf area at n DAS

