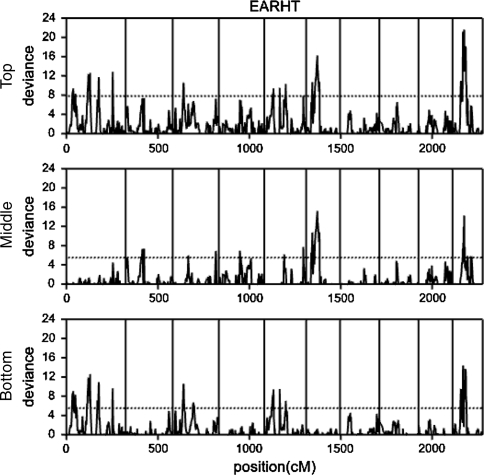
Fig. 2.
Mixed model profiles for QTL effects for ear height across genome. Upper panel test statistic profile for existence of additive QTL effects in one or both heterotic groups. Middle panel test statistic profile for QTL in heterotic group 1. Lower panel test statistic profile for QTL in heterotic group 2. The dashed horizontal lines mark a point wise significance threshold at test level 0.01

