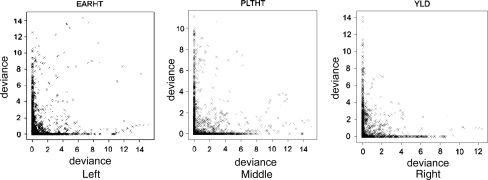
Fig. 3.
Complementarity of QTL segregation patterns. Values of deviance statistics representing test on QTL in heterotic group 2 versus test in group 1 for all evaluation points in genome. Left for ear height, middle for plant height, right for yield. Concentration of points near horizontal and vertical axes together with relative absence of points close to diagonal forms an indication for complementarity of QTL segregation patterns in the two heterotic groups

