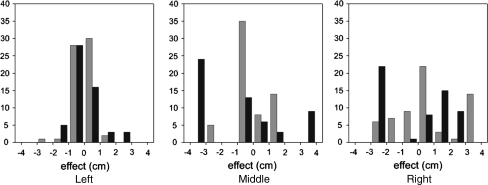
Fig. 5.
Histogram for REML (left and middle) and Bayesian (right) mixed model founder effects at the peaks of the REML test profile and the Bayesian intensity profile at chromosome 10. In gray (black), the founder effects of heterotic group 1 (2). The left panel shows the estimated effects assuming that the founders are unrelated. In the middle panel, relations between founders are structured. In the right panel, Bayesian founder effects are given as obtained from the product of posterior founder QTL genotype probabilities and posterior QTL genotypic values

