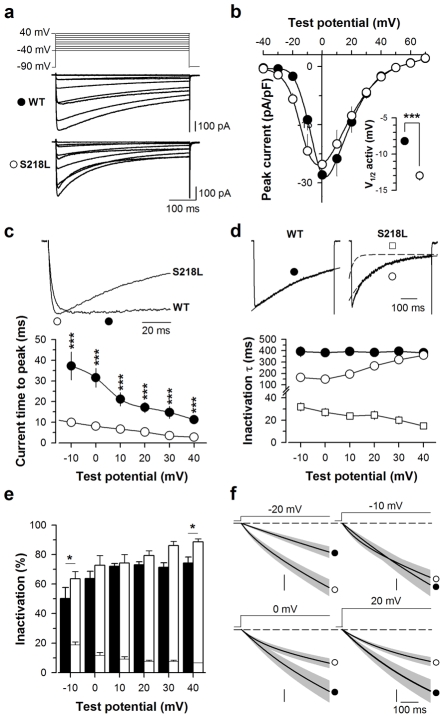
Fig. 1.
The familial hemiplegic migraine type 1 (FHM-1) mutation S218L induces kinetic and voltage alterations of Cav2.1 calcium channel activity. a Average set of whole cell current traces for Cav2.1WT/β4/α2δ-1b (n = 13) and Cav2.1S218L/β4/α2δ-1b (n = 13) channels obtained by 500 ms depolarization values ranging between −40 and 40 mV. Holding potential is −90 mV. b Average current-voltage relationships for currents measured at their peak values. Inset: average half-activation potentials for wild-type (filled circles) and mutant (open circles) channels. c Representative current traces at 0 mV showing differences in activation kinetics (top panel). Symbols illustrate the time to peak. Average current time to peak values as a function of test potentials for wild-type (filled circles, n = 13) and mutant (open circles, n = 13) channels (lower panel). d Representative current traces at 0 mV for wild-type and mutant channels showing differences in inactivation kinetics (top panel). Inactivating currents were fitted (dashed line) by a mono-exponential equation (wild-type channels, filled circle) or a bi-exponential equation (mutant channels, open square for fast component and open circle symbol for slow component). Average inactivation time constants for both conditions (n = 13 for control and n = 13 for mutation) as a function of test potential (lower panel). The y-axis presents a break point for display purposes. e Average proportion of each inactivating component for wild-type (filled bars, n = 13) and mutants channels (open bars, n = 13). f Average integrated whole cell currents for wild-type (filled circle, n = 13) and S218L mutant (open circle, n = 13) channels at −20 mV, −10 mV, 0 mV and 20 mV. Vertical scale: 500, 1000, 2000 and 1000 pA. ms. pF−1 respectively. Data are presented as mean ± S.E.M for n studied cells. Statistical t test: NS, non significant; *, p ≤ 0.05; ***, p ≤ 0.001.

