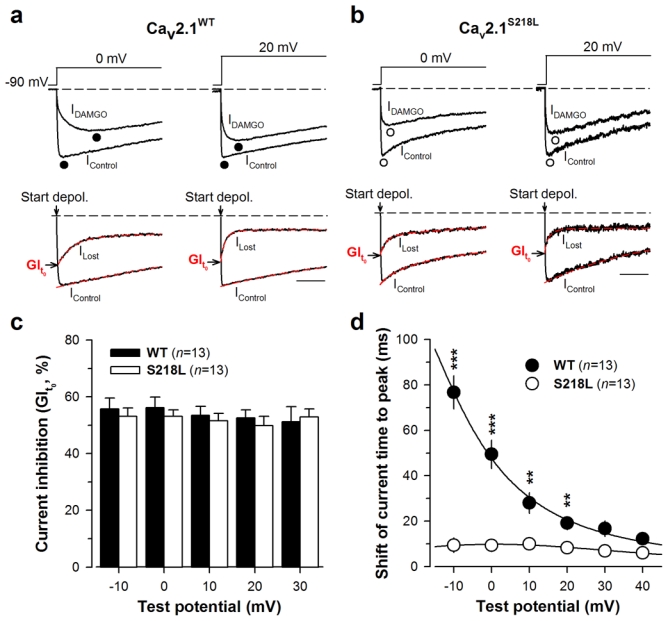
Fig. 2.

The S218L mutation does not affect the maximal G-protein inhibition of Cav2.1 currents. a Representative normalized current traces elicited at 0 and 20 mV before (IControl) and under 10 μM DAMGO application (IDAMGO) for Cav2.1WT channels with β4 and α2δ-1b auxiliary subunits (top panel). Corresponding traces allowing the measurement of the maximal DAMGO inhibition at the start of the depolarisation (GIt0) (bottom panel). IControl and ILost (obtained by subtracting IDAMGO from IControl) were fitted (red dashed line) by a mono- and a double-exponential, respectively, in order to better estimate GIt0. The arrow indicates the start of the depolarisation. Scale: 50 ms. b Legend as in (a) but for cells expressing Cav2.1S218L channels with β4 and α2δ-1b auxiliary subunits. c Bar chart representation of GIt0 for Cav2.1WT (filled bars, n = 13) and Cav2.1S218L (open bars, n = 13) channels as a function of membrane potential. d Shift of the current time to peak induced by DAMGO application for Cav2.1WT/β4/α2δ-1b channels (filled circle, n = 13) and Cav2.1S218L/β4/α2δ-1b channels (open circle, n = 13) as a function of membrane potential. Data are presented as mean ± S.E.M for n studied cells. Statistical t test: NS, non-significant; **, p ≤ 0.01; ***, p ≤ 0.001.
